21 - Rising Temperatures

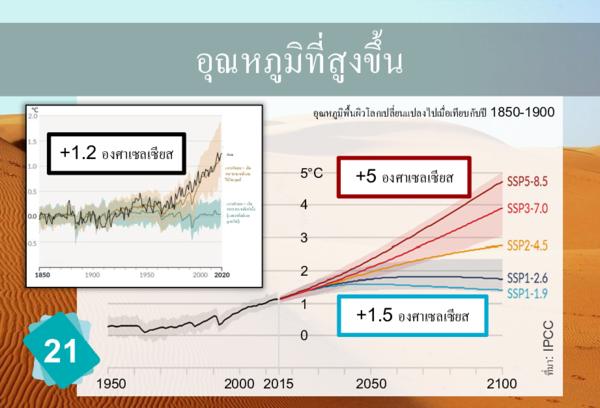
° C 5 4 3 2 1 0 2000 2015 2050 2100 21 1950 ที่มา : IPCC แบบจ าลอง - เกิด จากธรรมชาติเท่านั ( แสงอาทิตย์และ ภูเขาไฟ ) แบบจ าลอง - เกิด จากธรรมชาติและ ฝีมือมนุษย์ สังเกต อุณหภูมิพืนผิวโลกเปลี่ยนแปลงไปเมื่อเทียบกบปี 1850 - 1900 + 5 องศาเซลเซียส + 1 . 5 องศาเซลเซียส + 1 . 2 องศาเซลเซียส อุณหภูมิที่สูงขึ
ชุด 1 www.climatefresk.org 21 อุณหภูมิอากาศเฉลี่ยที่พืนผิวโลกเพิ่มขึ 1 .2 ° C ตังแตปี 1900 ถานการณ์การปลอย าซในอนาคตที่เป็นไปได้คาดการณ์วาการเพิ่มขึนนีจะสูงถึงระหวาง 2 ถึ 5 ° C ภายใน ปี 2100 ในชวงยุคน าแข็งสุดท้ายเมื่อ 20 , 000 ปีที่แล้ว อุณหภูมิอากาศเฉลี่ย ต ่ากวาปัจจุบันเพียง 5 องศาเซลเซียส และใช้เวลา 10 , 000 ปีในการที่อุณหภูมิอุนขึ

1
Cause

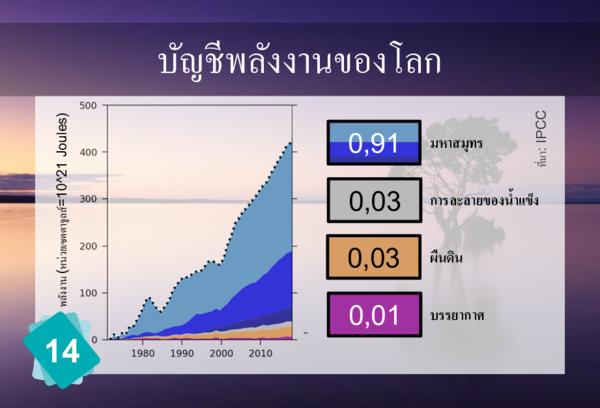
Energy Budget

Energy Budget

As mentionned on card 21, this is the temperature of the air, above ground, in average on the Earth.

5
Consequences

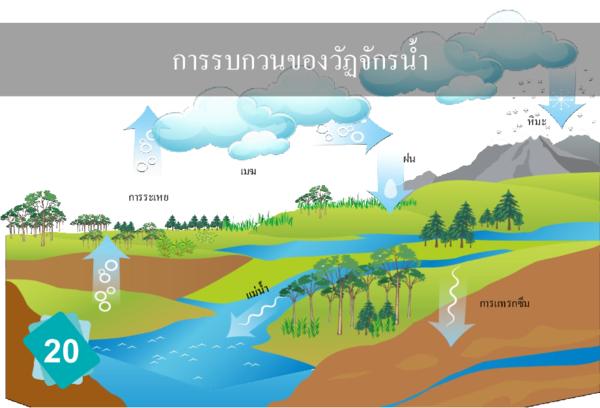
Disruption of the Water Cycle

Rising Temperatures


Terrestrial Biodiversity

Rising Temperatures


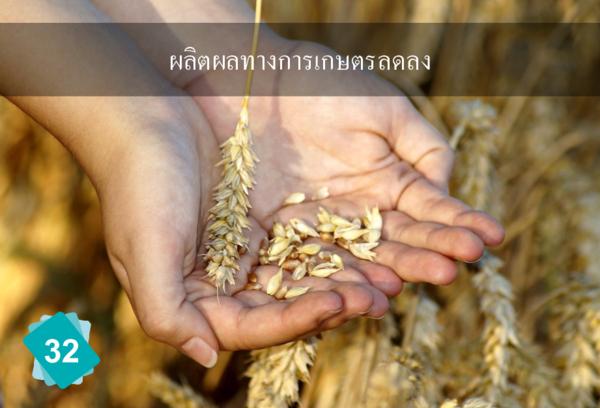
Decline in Agricultural Yields

Rising Temperatures

In northern countries, a little increase in temperature can lead to better yields, but in southern countries, it's the contrary: Any degree warmer is a decrease in yields.
Heatwaves

Rising Temperatures


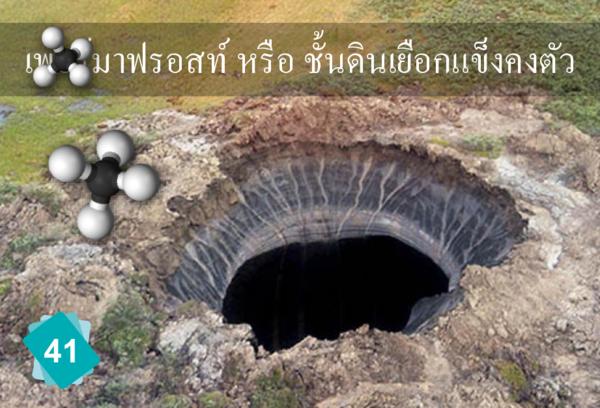
Permafrost

Rising Temperatures


2
Other possible consequences

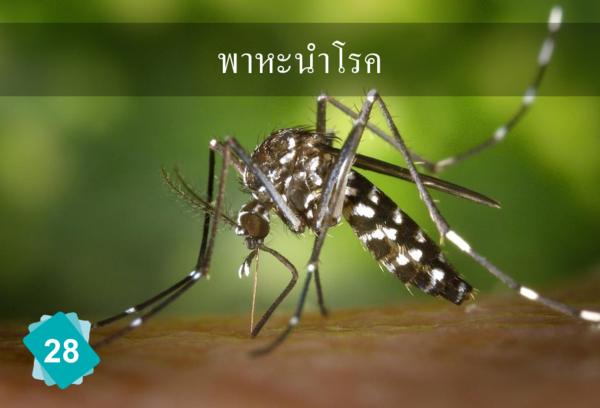
Vectors of Disease

Rising Temperatures

The vectors of disease card is generally linked to the Terrestrial Biodiversity card because disease vectors are a sub-part of biodiversity, but it can also be linked to the same causes as the biodiversity card, i.e. Disruption of the Water Cycle and Rising Air Temperatures.
Human Health

Rising Temperatures


↩ Back