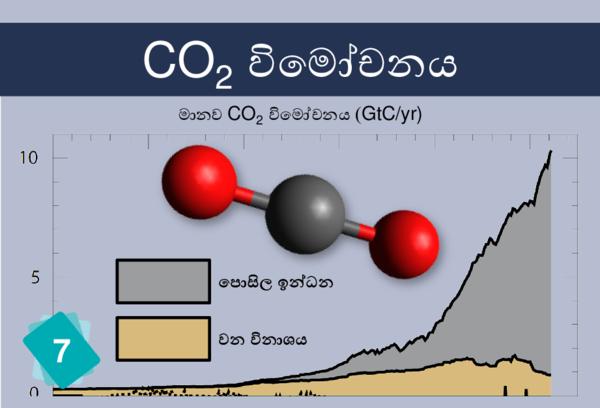
7 - CO2 Emissions
2Causes
1Consequence
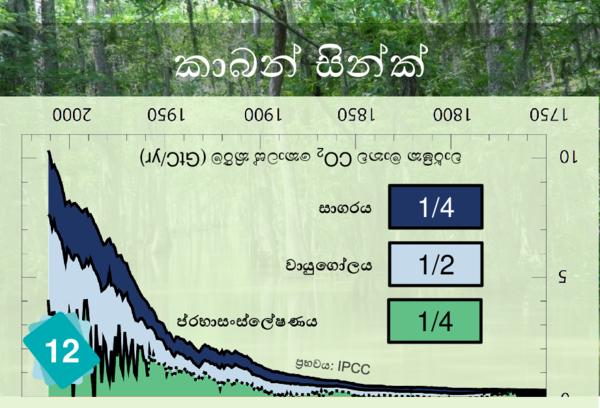
These two cards can be put border-to-border in order to reconstitute the original graph.
Ask the participants: "Have a look at card 12. What do you notice ? - It's written upside down - Exact. This is an enigma. The answer to it is on the table."
When they have found that 12 and 7 go together, then explain the resulting graph: it shows where the CO2 comes from and where it goes to. This is why the outer curves are symetricals. Each year, the CO2 emitted by Human beings has to go somewhere. If it's not in the carbon sinks, then it's in the atmosphere.
1Other possible cause
Agriculture does not emit much CO2 except from deforestation. Its carbon emissions mainly come from othe GHGs.
2Wrong consequences
Why not, but better link card 12 (Carbon sinks) to card 11. Card 12 is meant for that.
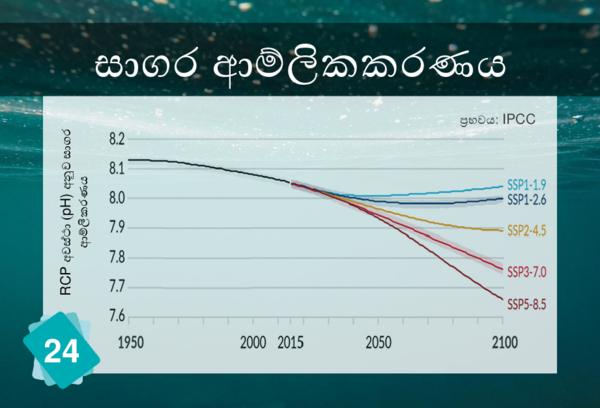
Why not but rather link Card 12 (Carbon sinks) to card 24. It is meant for it.


