21 - Wzrost temperatury

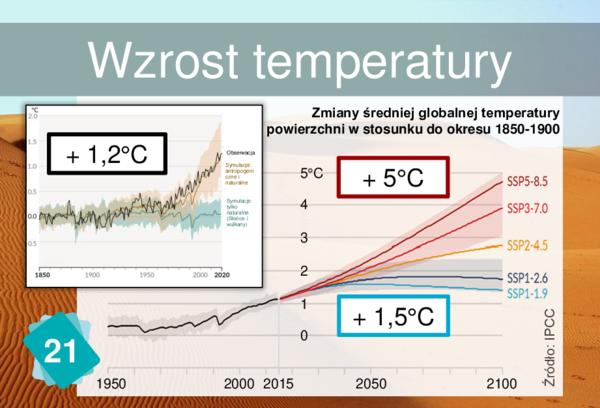
° C 5 4 3 2 1 0 2000 2015 2050 2100 21 1950 Źródło: IPCC Symulacje: tylko naturalne (Słońce i wulkany) Symulacje: antropogeni czne i naturalne Obserwacja Zmiany średniej globalnej temperatury powierzchni w stosunku do okresu 1850 - 1900 + 5 ° C + 1,5 ° C + 1,2 ° C Wzrost temperatury
Zestaw 1 www.climatefresk.org 21 Chodzi tutaj o średnią temperaturę powietrza na powierzchni Ziemi, która od 1900 r. wzrosła już o blisko 1,2 ° C. Według przewidywań do 2100 r. może się podnieść o 2 - 5 ° C. W czasie ostatniego zlodowacenia (20 000 lat temu) była ona zaledwie o 5 ° C stopni niższa od dzisiejszej... A zanik lodowca trwał 10 000 lat!

1
Cause

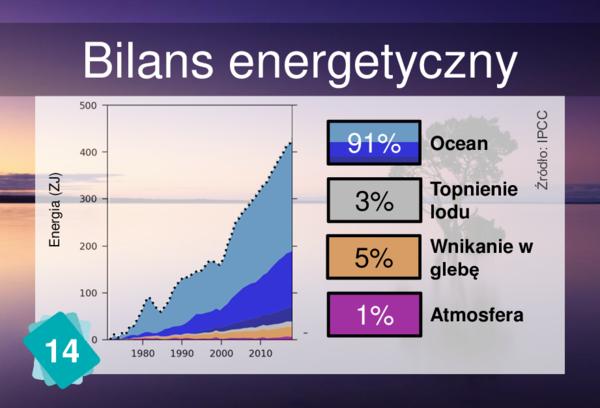
Bilans energetyczny

Bilans energetyczny

As mentionned on card 21, this is the temperature of the air, above ground, in average on the Earth.

5
Consequences

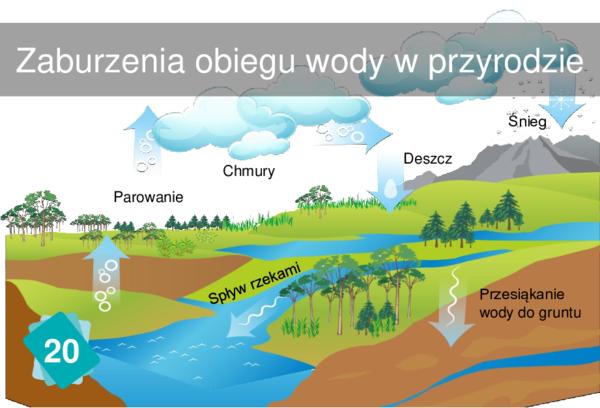
Zaburzenia obiegu wody w przyrodzie

Wzrost temperatury


Bioróżnorodność lądowa

Wzrost temperatury


Spadek plonów rolnych

Wzrost temperatury

In northern countries, a little increase in temperature can lead to better yields, but in southern countries, it's the contrary: Any degree warmer is a decrease in yields.
Upały

Wzrost temperatury


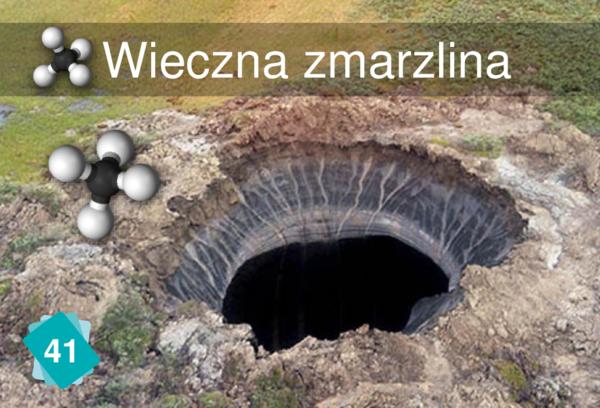
Wieczna zmarzlina

Wzrost temperatury


2
Other possible consequences

Nosiciele chorób

Wzrost temperatury

The vectors of disease card is generally linked to the Terrestrial Biodiversity card because disease vectors are a sub-part of biodiversity, but it can also be linked to the same causes as the biodiversity card, i.e. Disruption of the Water Cycle and Rising Air Temperatures.
Zdrowie człowieka

Wzrost temperatury


↩ Back