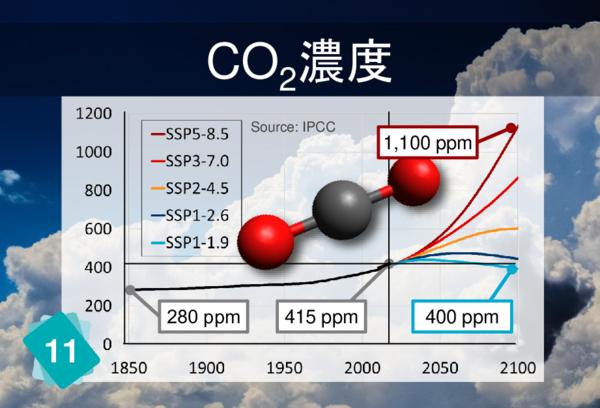
11 - CO2濃度(ppm)
1Cause
the card n11 represents the concentration in CO2, understood in the atmosphere (it's written behind the card).
1Consequence
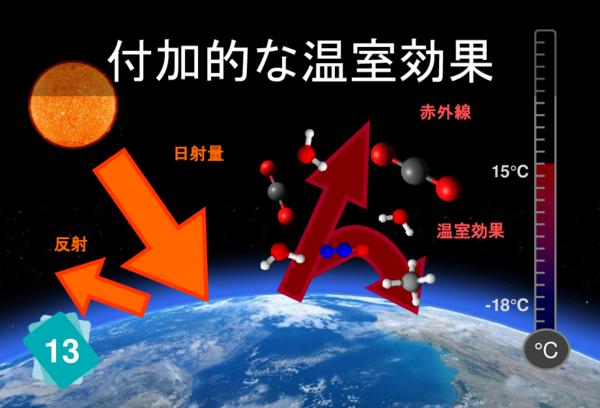
You can recognize the molecules of the different GHGs on the card 13 : H2O (red and white), CO2 (grey and red), CH4 (grey and white), nitrious (blue and red).
1Wrong cause
2Wrong consequences
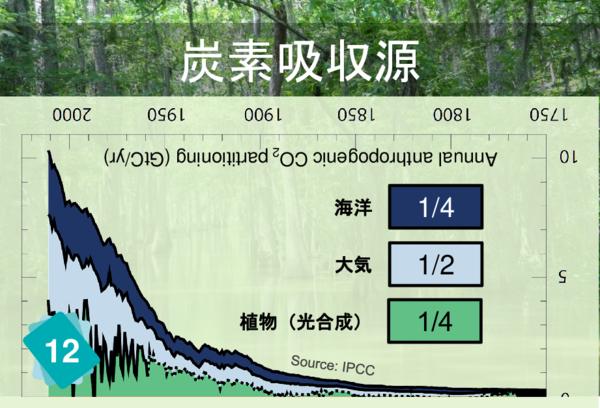
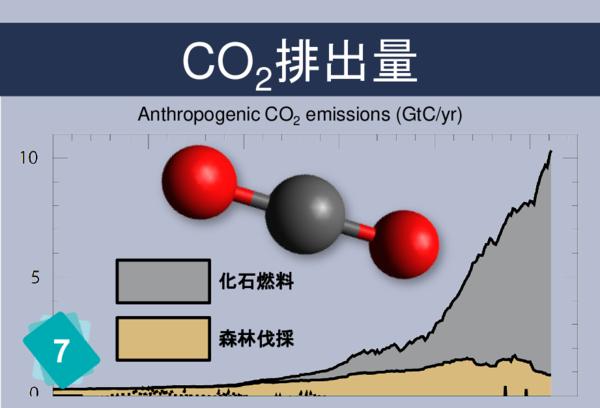
It can be argued that CO2 emissions take place before reaching carbon sinks. But the opposite link has our preference.
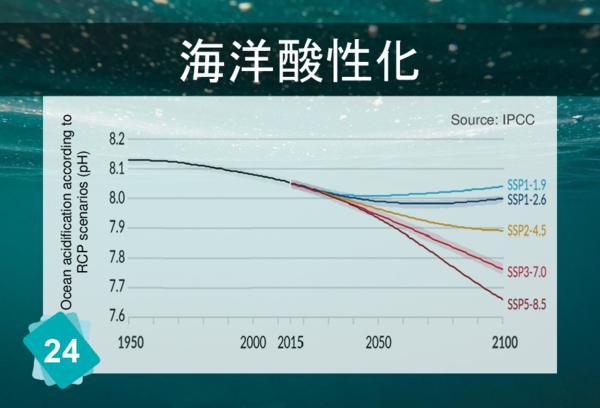
Players often identify CO2 concentration as a cause for ocean acidification. But it is more logical to link back to carbon sinks.


