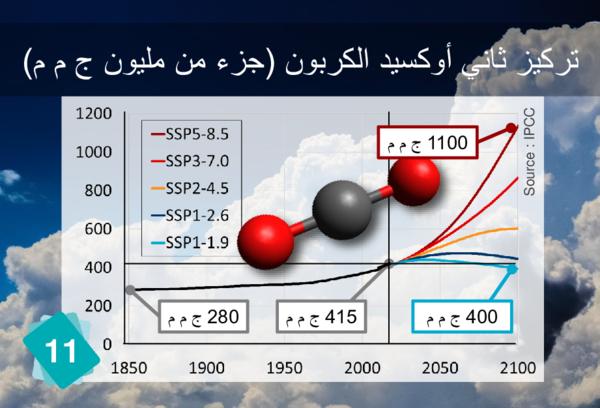
11 - Concentration of CO2 (ppm)

11 1100 م م ج 280 م م ج 400 م م ج 415 م م ج نوبركلا ديسكوأ يناث زيكرت ( م م ج نويلم نم ءزج ) Source : IPCC
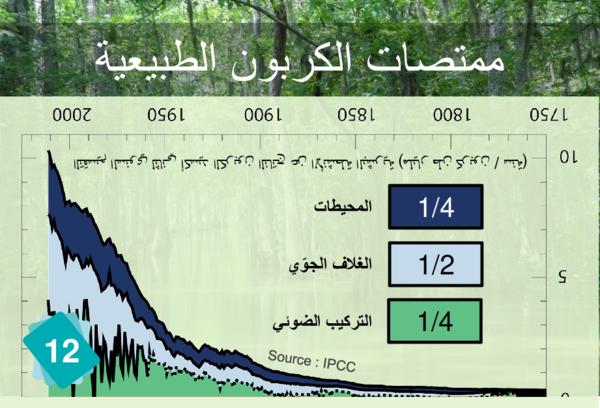
Set 2 www.climatefresk.org 11 متي طاقتلإ نوبركلا ديسكأ يناث تاثاعبنا فصن فصنلا ىقبيو ،ةيعيبطلا نوبركلا تاصتمم ةطساوب (CO 2 ) يوجلا فلغلا يف رخلا . عفترإ ف نوبركلا ديسكأ يناث زيكرت ي نم يوجلا فلغلا 280 ىلإ 415 نويلملا يف ءزج ( م م ج ) للخ 150 ةريخلا اًماع . ىلإ ةنس نييلم ةثلث دوعن نأ انيلع ضرلل يوجلا فلغلا يف تازيكرتلا هذه لثم دجنل ءارولا .

1
Cause

Carbon Sinks

Carbon Sinks

the card n11 represents the concentration in CO2, understood in the atmosphere (it's written behind the card).

1
Consequence

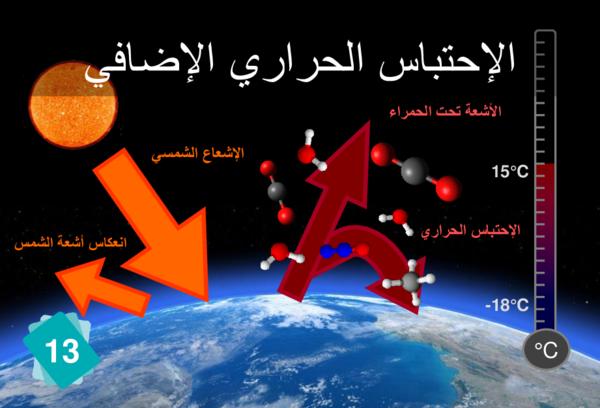
Additional Greenhouse Effect

Concentration of CO2 (ppm)

You can recognize the molecules of the different GHGs on the card 13 : H2O (red and white), CO2 (grey and red), CH4 (grey and white), nitrious (blue and red).

1
Wrong cause

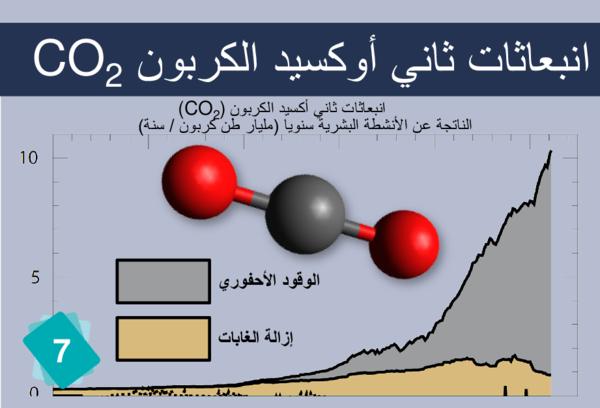
CO2 Emissions

CO2 Emissions

Why not, but better link card 12 (Carbon sinks) to card 11. Card 12 is meant for that.

2
Wrong consequences

Carbon Sinks

Concentration of CO2 (ppm)

It can be argued that CO2 emissions take place before reaching carbon sinks. But the opposite link has our preference.
Ocean Acidification

Concentration of CO2 (ppm)

Players often identify CO2 concentration as a cause for ocean acidification. But it is more logical to link back to carbon sinks.
↩ Back